2023 Survey Results: An Overview
This post provides a few more results from the 2023 survey (organized with the help of Neelum Maqsood). As background, the 2023 survey departed from previous APDA surveys in being offered on the Qualtrics platform rather than on our own website. For this reason, we had to adapt the structure of the survey to better fit that platform. For example, we couldn't filter the questions based on our database because the survey was not linked to our database. Around 1,121 participants took part, which is about a 15% response rate (in line with recommendations for a total population of this size), skewed toward those in permanent academic jobs. There is, of course, overlap with past surveys and participant numbers do not include anyone who took a survey in past years.
In what follows I provide some survey results organized by survey section and framed around the questions posed to participants, with bold used to demarcate relevant questions and results. There are four such sections: program-related questions, questions regarding diversity and inclusivity, employment questions, and demographic questions. Want to know how conservative philosophers differ from other underrepresented groups? How many current students report a mental health condition? Some ideas about how to improve inclusivity? How international students do on the job market? Read on...
Program-Related Questions
The first set of questions concerned the participant's PhD program and was the same for all participants. The first two of these questions were used to filter later questions and analyses. Brackets indicate the response options provided to participants with proportion of responses (rounded to the nearest integer).
- Select the program from which you obtained or will obtain your PhD. [203 PhD programs and "other"]
- Select the year you obtained your PhD. If you are still a student, select "current student." [63% 2013 to 2023 and 37% "current student"]
- How likely would you be to recommend this program to prospective PhD students? [4% definitely would not recommend, 10% somewhat unlikely, 12% neither likely nor unlikely, 31% somewhat likely, 43% definitely would recommend]
- Please elaborate on your previous answer.
- Select from this list up to 5 keywords that you would associate with this program. [48% Analytic to <1% Islamic]
- Rate your satisfaction with this program’s efforts to foster a healthy, respectful academic culture or climate. [4% very unsatisfied, 8% unsatisfied, 17% neutral, 38% satisfied, 33% very satisfied]
- Please elaborate on your previous answer.
- Rate your satisfaction with the mental health services made available to students in this PhD program. [5% very unsatisfied, 11% unsatisfied, 42% neutral, 26% satisfied, 17% very satisfied]
- Please elaborate on your previous answer.
Recommendations and keywords are captured in our infographic. It is worth focusing, then, on the questions of climate and mental health. First, the mean rating for program climate is 3.9 out of 5 or "satisfied," but lower for most underrepresented groups (a previous survey found this to be true for questions on diversity and inclusion). The chart below shows both recommendation and climate ratings for various forms of identity. Interestingly, unlike other forms of underrepresentation, underrepresented political affiliation (i.e. conservative or very conservative) does not correspond with lower climate ratings. Although I did not test this difference for significance, this apparent difference could be because the climate is better for conservative students, because conservative students tend to rate things highly, or because these responses don't reflect conservative students' true views on the matter.

On the mental health question, the plurality chose "neutral," with many saying they didn't know what resources were available or didn't use them. Those who answered "unsatisfied" or "very unsatisfied" report no or nearly no services for mental health in comments, whereas those who answered "satisfied" or "very satisfied" said that their health insurance covered mental health or the university offered counseling. For example:
- very unsatisfied: "There was absolutely zero mental health service. "
- very satisfied: "We have great health insurance that allows me to see a therapist regularly"
This issue is worth exploring at individual campuses to the extent possible, as the mental health crisis continues in graduate education, with 36% of current students reporting a mental health condition in this survey (compared to 25% of all graduates).
Questions Regarding Diversity and Inclusivity
The second set of questions addressed issues related to diversity and inclusivity and was also the same for all participants.
- When you interact with other philosophers in professional and social settings, how comfortable do you find yourself? [4% very uncomfortable, 13% uncomfortable, 17% neither comfortable nor uncomfortable, 46% comfortable, 20% very comfortable]
- Please elaborate on your previous answer.
- How welcoming do you find academic philosophy to be toward students who are members of underrepresented groups? [6% very unwelcoming, 22% unwelcoming, 32% neither welcoming nor unwelcoming, 29% welcoming, 10% very welcoming]
- Please elaborate on your previous answer.
- What steps should philosophy take to become more inclusive, if any?
As above, we can look at these questions by identity status, resulting in a similar story. Notably, all groups are neutral or negative about how welcoming philosophy is to members of underrepresented groups except for conservative and very conservative participants. Again, this was not tested for significance. Conservative students provide similar ratings to other underrepresented groups on comfort, which seemingly excludes an explanation of their providing generally high ratings. It may nonetheless be the case that such students either genuinely perceive philosophy as welcoming or that this does not capture their true views (i.e. because it is a speech act or because it is a biased sample).

Comments on how to make philosophy more inclusive include:
- increase the diversity of conferences, curricula, faculty and students (e.g. "Diversifying the curriculum and our image of what a great philosopher looks like is one important step that I've worked at. I think there's probably a lot else that needs to be done, but others in the field would be better equipped to speak to these things than me.")
- develop transparent standards and practices (e.g. "Hold faculty accountable for their actions towards their students and make their behavior transparent to the public. There urgently need to be accountable mechanisms for faculty who turn against their students that are in fact enforced.")
- stand up against harassment and the "isms" (e.g. "Senior academics engaging in this kind of behavior need to face much more serious consequences, both institutionally and/or legally but also in terms of more firm denouncement by other (senior) academics and better bystander behavior.")
- foster interdisciplinarity (e.g. "Stop the de-facto disciplinary policing against interdisciplinary work: this will already help to include people who work also or only in adjacent fields of study, many of those from under-represented groups.")
- develop communities and cultures of inclusivity (e.g. "fostering a community of empathetic collaboration, shaped by low hierarchies, education, and extensive in-person social contact")
- financial support and prizes (e.g. "Honestly, providing adequate financial support would go a long way towards making the discipline more inclusive." and "Give more money to efforts that try to increase diversify and award scholars for work that explores these areas.")
- mentorship of those from underrepresented groups (e.g. "Institutional focus, incentives, and constant discussion on the mentor relationship. Too often, mentors/advisers traumatize, disparage, ignore, or else underserve their students. I feel like advisers rely on 'proximity to genius' to support their students, when this does very little and may even do harm, especially for inclusivity.")
- global perspective (e.g. "Traditional philosophy curricula often focus heavily on Western philosophical traditions. Incorporating philosophical thought from other cultures can provide a more inclusive, diverse, and global understanding of philosophy.")
Employment Questions
Some of these results were discussed in earlier blog posts, so I will provide just a few results and charts here.
This set of questions had to do with employment and was thus dependent on the participant's graduation status. The first question was provided only if the student selected a graduation year (not "current student"):
- What is your current employment type? [83% academic, 14% non-academic, 3% current student or unemployed]
Subsequent questions depended on the participant's answer to the first question. For instance, those who selected "academic" were asked:
- Which of the following terms best describes your current employment? [69% permanent, 31% temporary]
Those who selected "non-academic" were asked:
- Which of the following sectors best describes your current employment? [24% education (e.g. high school teacher, university administrator, alt-ac), 23% technology (e.g. software developer), 17% government (e.g. federal agency), 14% nonprofit/NGO (e.g. charitable organization, think tank), 6% other (e.g. arts, food & drink), 5% consultancy (e.g. consulting for a private firm), 4% law (e.g. attorney), 4% media/publishing (e.g. journalist, editor), 1% finance (e.g. bank), 1% health (e.g. hospital ethicist)]
Both of those groups were asked:
- How satisfied are you in your current employment? [3% very unsatisfied, 7% unsatisfied, 13% neutral, 43% satisfied, 35% very satisfied]
- Please elaborate on your previous answer.
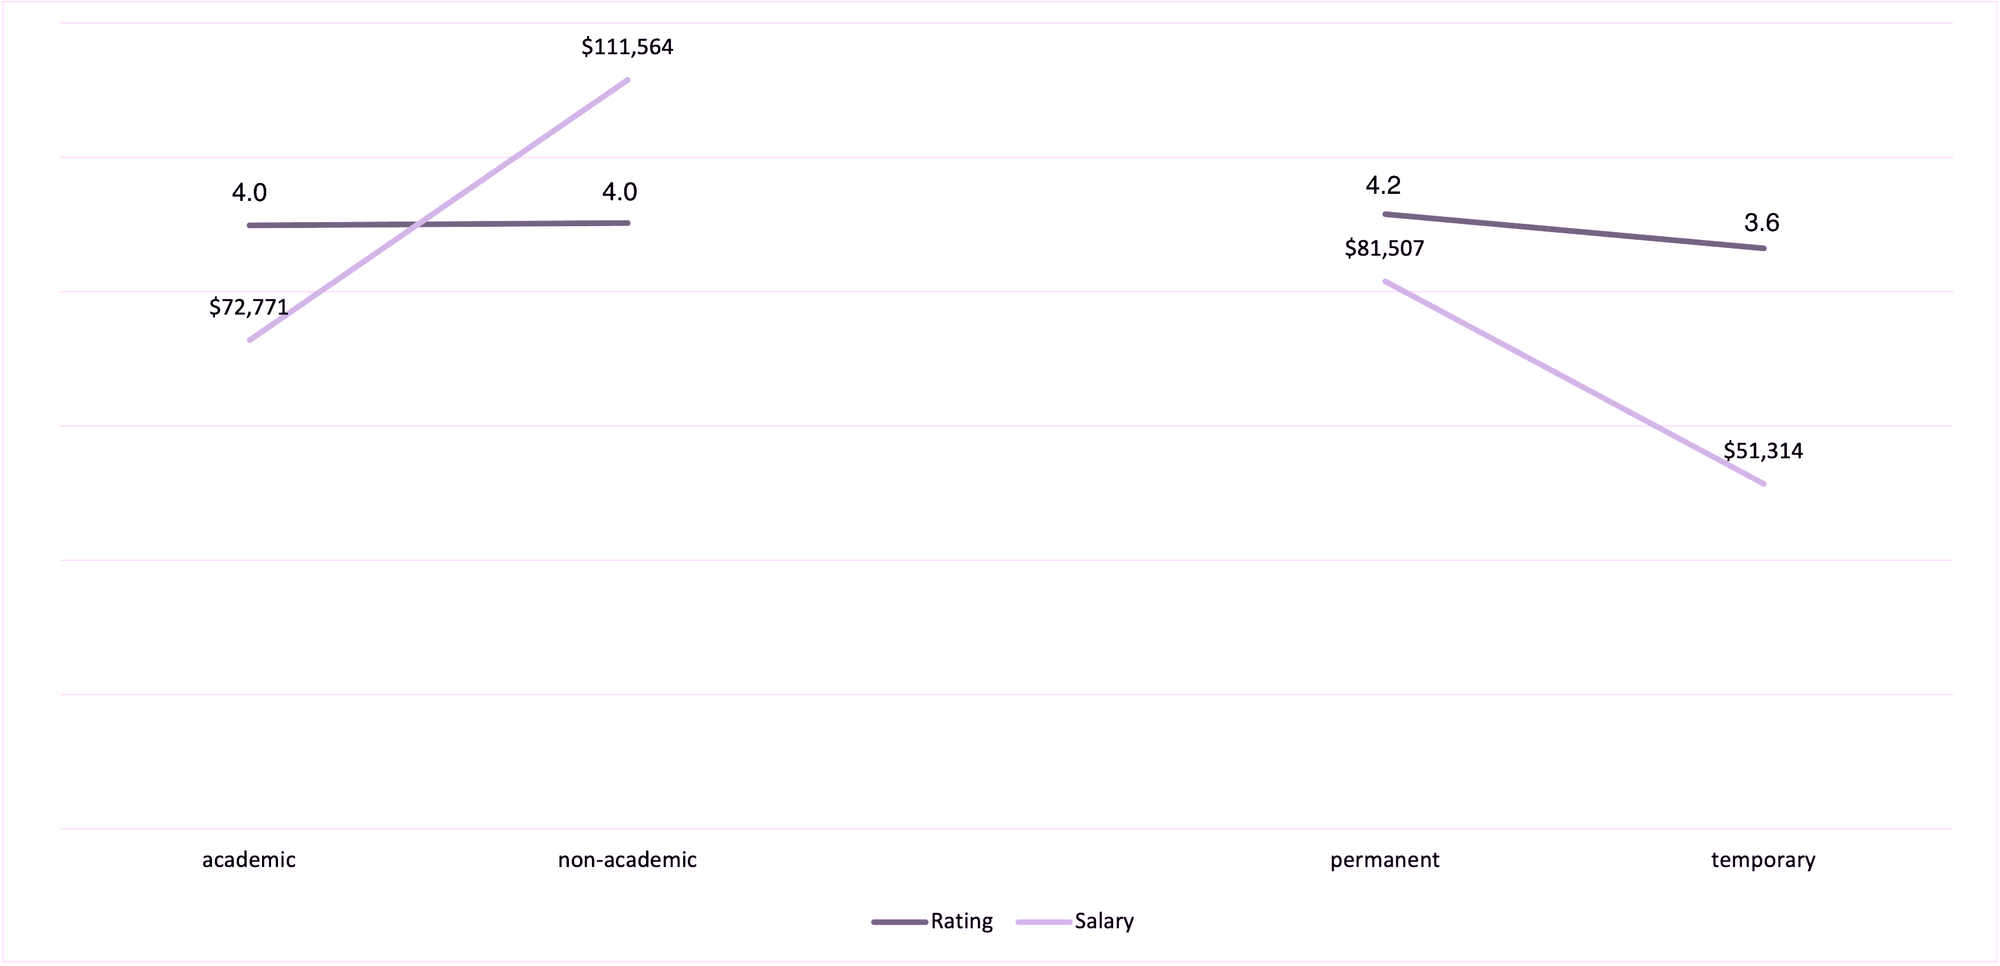
- What is your approximate yearly salary? (Please provide in US dollars or name the currency you are using; mean of $78,276.)
Note that while satisfaction in academic and non-academic jobs is about the same (but higher for permanent than for temporary academic jobs), the salaries for those in non-academic jobs are much higher, which has been reported in previous surveys.

Those who either selected "current student" on the graduation year question or selected "current student or unemployed" on the employment status question were asked the following:
- How satisfied are you in your financial situation? [17% very unsatisfied, 25% unsatisfied, 19% neutral, 28% satisfied, 10% very satisfied]
- Please elaborate on your previous answer.
- Including all sources (e.g. stipends, employment, gifts) what is your approximate annual income? (Please provide in US dollars or name the currency you are using; mean of $30,183)
Finally, every participant was asked:
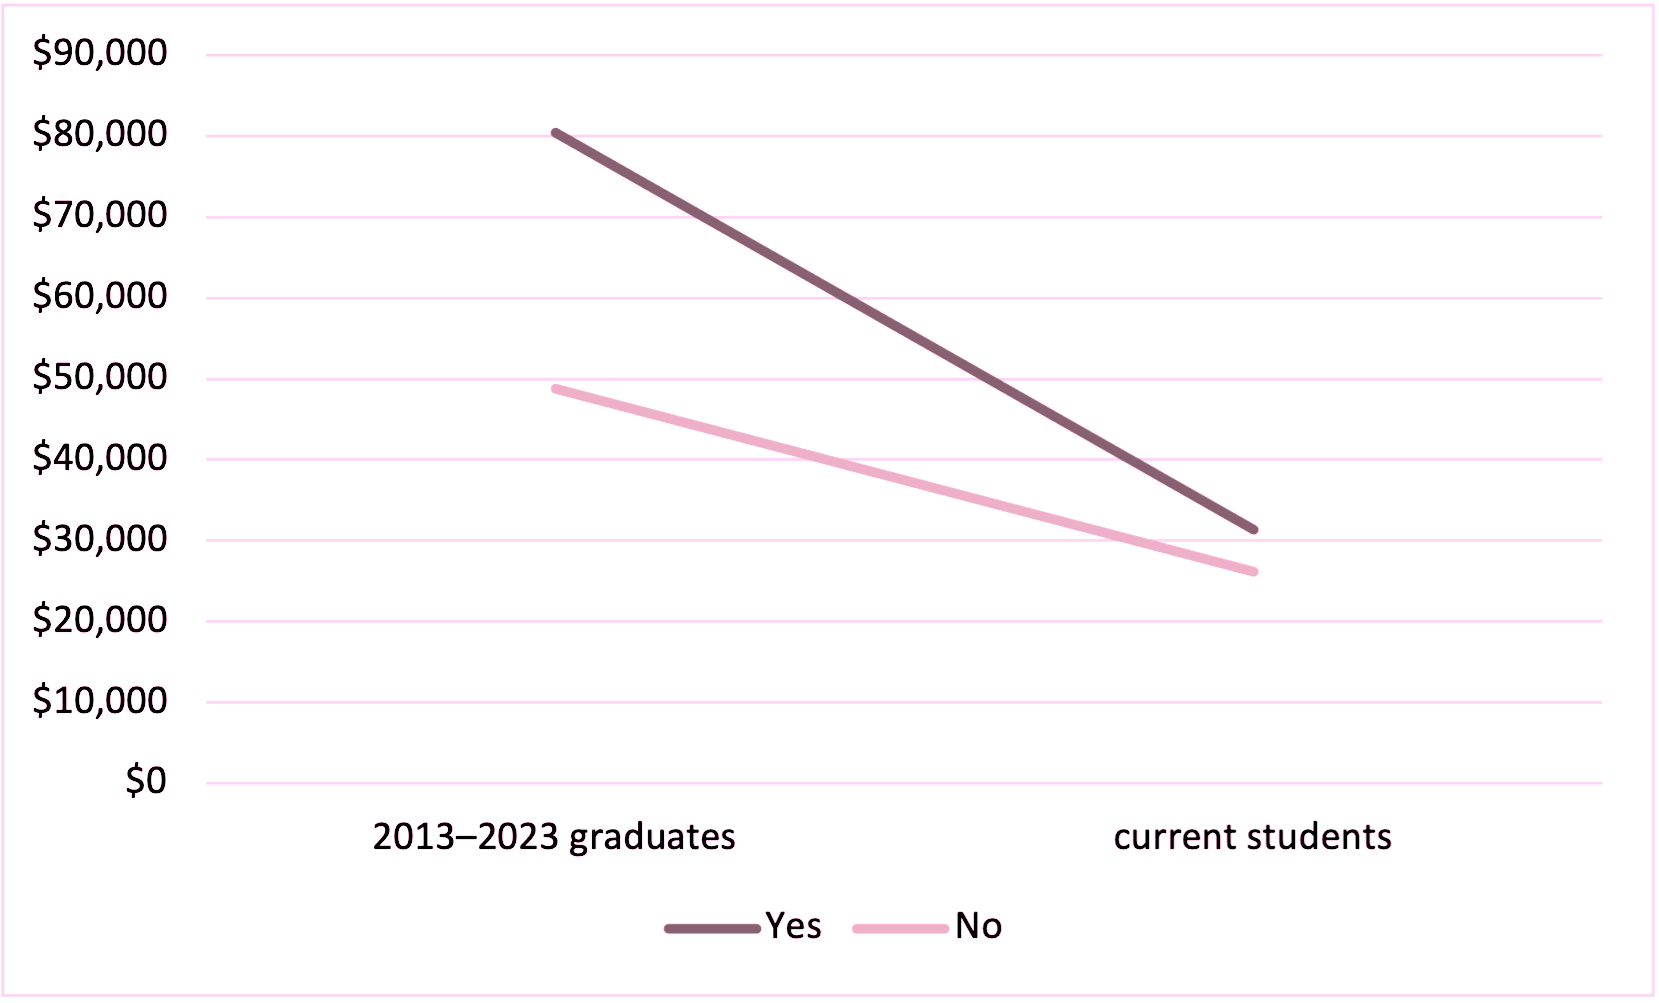
- If you needed access to $1000 or its equivalent for emergency purposes, could you get it? [88% yes, 12% no]
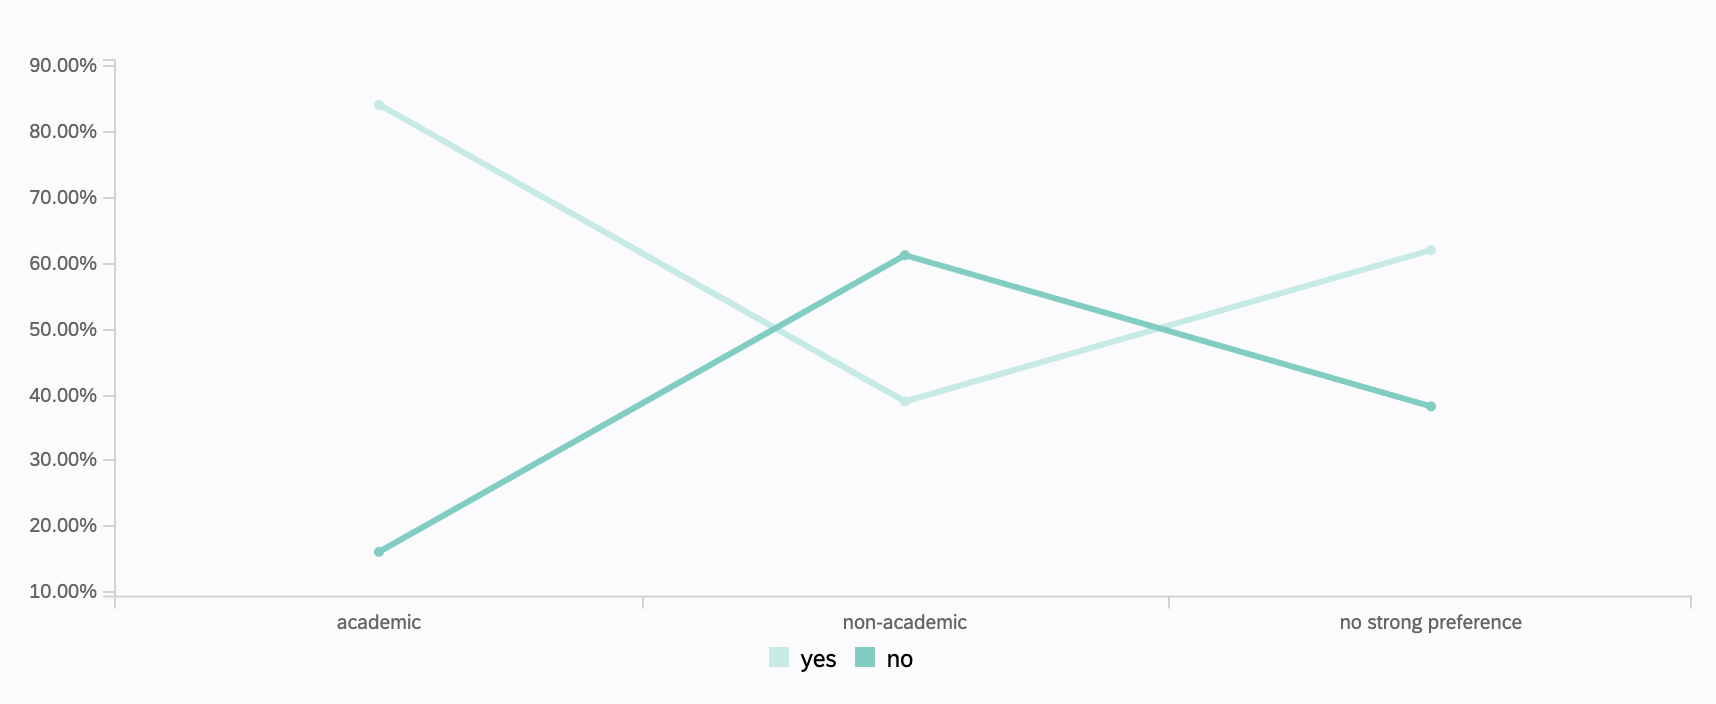
- What kind of employment would you prefer? [81.6% academic, 7.0% non-academic, 11.4% no strong preference]
- Would you move more than 500 miles if required for your preferred kind of employment? [78% yes, 22% no]
On these questions, note that whether participants said they could obtain $1,000 for emergency purposes depended on their employment type and graduation year. For instance, graduates who said they could not obtain these funds had a mean salary of $48,809, which is higher than the mean for all current students, including those who said they could obtain such funds. This difference could be due to the addition of dependents over time, independent sources of wealth, or subjective influences.

Finally, whether or not someone would move corresponds with their employment priorities, with those who are prioritizing an academic job much more likely to say they would move (84%) than those prioritizing non-academic jobs (39%) and even those with no strong preference (62%).

Demographic Questions
The final set of questions had to do with the participant's identity and background (with results rounded to the tenth in this case).
- Which of the following gender terms best describes you? [64.4% man, 4.1% non-binary, 1.5% other, 30.0% woman]
- Do you identify as Trans*? [ 2.9% yes, 97.2% no]
- Which of the following sexual identities best describes you? [11.5% bisexual, 3.3% gay, 1.6% lesbian, 4.2% other, 6.7% queer, 72.6% straight]
- What language(s) was spoken at home while you were growing up?
- Are you or were you an international student during your PhD studies? [30.3% yes, 70.0% no]
- What was your family's socioeconomic status (SES) growing up? [11.5% lower, 22.0% lower-middle, 35.0% middle, 28.6% upper-middle, 3.0% upper]
- What is the highest education level obtained by at least one of your parents/guardians? [1.5% before high school, 12.0% high school (6th form), 7.6% some college or university, 3.0% associate’s degree, 24.4% bachelor’s degree, 20.2% master’s degree (MA, MSc, MPhil, MLitt, etc.), 15.8% professional degree (MD, JD, LLM, MBA, etc.), 15.6% doctoral degree (PhD, EdD, etc.)]
- Are you in the military or are you a veteran of the military? [2.9% yes, 97.2% no]
- Which of the following best describes your disability status, treating disability according to the ADA definition: "a physical or mental impairment that substantially limits one or more major life activity"? Please choose all that apply. [59.2% no known disability, <1% blind or visual impairment uncorrected by glasses, <1% deaf or serious hearing impairment, <1% general learning disability (e.g. Down's syndrome), 5.8% long-standing illness or health condition (e.g. cancer), 32.7% mental health condition (e.g. depression), 2.2% physical impairment or mobility issues (e.g. difficulty using arms), 5.1% social/communication impairment (e.g. autism spectrum disorder), 4.5% specific learning disability (e.g. dyslexia), 3.0% other type of disability]
- Do you identify as Chicanx, Latinx, or Hispanic? [6.4% yes, 93.6% no]
- How do you identify by race? If you identify as "two or more races," please choose all that apply. [0.9% American Indian or Alaskan Native, 10.5% Asian or Asian American/Pacific Islander, 2.4% Black or African American, 4.4% Chicanx/Latinx/Hispanic, 4.2% Other (e.g. MENA), 3.6% Two or More Races, 74.0% White]
- Fill in any additional details of your racial identity, as needed.
- When it comes to politics, how do you usually think of yourself? [48.3% very liberal, 32.4% liberal, 14.5% moderate, 3.5% conservative, 1.3% very conservative]
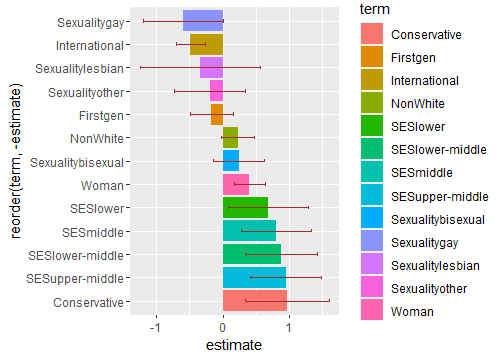
These proportions have not been tested for statistical significance against other datasets, including census values and past surveys, but readers are welcome to do so with the knowledge that around 1,000 participants answered each of these questions. Neelum Maqsood tested a subset of these demographic variables (gender, sexual identity, international status, socioeconomic status, education level, race, and politics) against chances of obtaining a permanent academic job using a regression and found that international students are less likely to obtain permanent academic jobs (5% significance level; odds are 0.6 that of local students), a new finding for APDA that will need to be explored further. Below is a chart she developed with the model estimates, but note that only "international" and "woman" (10% significance level; see this paper for context and on why this is likely a recent phenomenon) are significant results.

