2022 Data Collection Results

Since January we have been collecting data on over 200 PhD programs. The sortable table published to the home page today includes ten years of data for around 140 programs, nearly 50 of which have so far been able to verify our data. Analysis of that data is below, but first note what is included on the table:
PhD Program: This list includes 143 PhD programs in philosophy that are tracked by our project. In 2022 we contacted over 200 programs to gather resources for our data collection efforts. Those who said they would assist us are marked with a shield. From February through May we updated our records using these resources. We then excluded those programs that are both missing public records and did not volunteer to assist the project. We asked included programs to verify our records between June and August. Those who have done so are marked with a starred shield.
Total Grads: The total number of 2012-2021 PhD graduates from that program. We used dissertation pages, placement pages, library records, and ProQuest to have as complete a record of PhD graduates as possible.* Our coverage is international, but better in the United States, due in part to privacy laws that prevent many other countries from publishing and sharing this information. In the United States we have around 90% of those graduates recorded by the National Science Foundation. There are 5,785 total graduates from these programs in this period, with an average of 40 graduates per program; there are 6,387 graduates from this period in the database overall.
Permanent Academic Job: The percentage of 2012-2021 PhD graduates whose most recent employment record is a permanent academic job, out of all PhD graduates in this time period for this program. We used placement pages, internet searches, and oversight from program representatives to achieve as complete and accurate a record of employment information as possible. This year we asked programs to point us to their placement records in January and checked and entered those records between January and May, asking the programs to check our work between June and August. 38% of all graduates in the database from this time period are now in permanent academic jobs.
Temporary Academic Job: The percentage of 2012-2021 PhD graduates whose most recent employment record is a temporary academic job, except anyone who took a permanent academic job in the same year, out of all PhD graduates in this time period for this program. 38% of all graduates in the database from this time period are now in temporary academic jobs.
Non Academic Job: The percentage of 2012-2021 PhD graduates whose most recent employment record is a non academic job out of all PhD graduates in this time period for this program (can include those who also have an academic job reported in the same year). 15% of all graduates in the database from this time period are now in non academic jobs.
Non Academic Sectors: This includes any non academic sector for which at least 3 PhD graduates between 2012 and 2021 have reported employment. These include: education (e.g. HS, alt-ac), tech (e.g. software developer), law (e.g. attorney), health (e.g. hospital, insurance), government (e.g. federal agency), finance (e.g. bank), consultancy, non-profit/NGO, arts (e.g. painter, writer), non-university research institution/think tank, religion (e.g. minister), media (e.g. journalist), publishing (e.g. UP editor), food & drink (e.g. bartender), sales (e.g. retail), travel/recreation (e.g. hospitality), military, or building/engineering/utilities.
Survey Participants: the number of 2012 and later graduates, including current students, who responded with an overall rating in one of the past surveys run by APDA. This number is likely larger than the N for the other ratings, since the corresponding questions for the other ratings did not appear in every survey. In each case the rating is included only if the N for that question is 5 or greater, otherwise the cell is left blank. The average N is 10.
Overall Program Rating: the mean response for 2012 and later graduates, including current students, to the question of whether these graduates would recommend their PhD program to others (5 is definitely would recommend, 4 is somewhat likely, etc.) While we did not run a new survey this year, we recalculated the ratings for this more recent group of students, removing any duplicate entries by taking the average response. (We intend to distribute the survey again in 2023, and every other year from here on out.) See our 2022 paper in Metaphilosophy for details on methodology. The average overall rating is 4.0.
Climate, Teaching, Research, and Financial Ratings: These are the mean responses for 2012 and later graduates, including current students, to questions about program climate ("Rate your satisfaction with this program’s efforts to foster a healthy, respectful academic culture or climate"; 5 is very satisfied), teaching preparation ("Rate your satisfaction with the advice and preparation this program provides to its graduate students for undergraduate teaching"), research preparation, and financial support. The average rating for climate is 3.9, for teaching is 3.7, for research is 3.9, and for financial support is 3.7.
Below are some initial analyses of this data:
The overall employment trajectories of philosophy PhD graduates from these programs can be visualized using a "Sankey" chart that depicts the most recent employment type (middle) for 2012-2021 graduates from each of three PhD program groups (left) along with a more detailed employment breakdown for some types (right):
The three groups are, in this case, sorted by permanent academic placement rate. Group 1 includes programs with the highest permanent academic placement rates, such as Yale and USC. Group 2 includes programs with the second highest permanent academic placement rates, such as Buffalo and Syracuse. Group 3 includes programs with the third highest permanent academic placement rates, such as Florida State and University of Georgia. The dividing line between these groups was chosen to best assist visualization, with near equal numbers of graduates from each of the three groups for this time period.
What can we learn from this graphic?
If you compare the thickness of the bars, you can pretty easily see differences in the three group's hiring patterns. Of these groups, Group 1 seems to strongly prefer hiring from its own group, hiring more than 2 times as many graduates from Group 1 as from Group 2, and 7 times as many from Group 1 as from Group 3. Group 2 seems to treat Group 1 and Group 2 as about the same, but hires 6 times as many graduates from one or the other of these groups as from Group 3. Group 3 hires from the groups in about equal numbers (visually, you can see that the bars are about the same width). This is not likely because Group 3 has fewer graduates to choose from: only a small proportion of graduates are hired by any of these groups. The majority of those in permanent academic jobs (72%) are hired by other institutions, even for Group 1 (70%). Further, the majority (69%) of these other permanent academic jobs are not even at institutions that offer doctorates, at least in the United States.
Of those in temporary academic jobs, most are not in postdoctoral or fellowship positions. This is true even if we zoom in on the most recent graduates of these programs: 54% of graduates between 2019 and 2021 that are in temporary academic positions are not in postdoctoral or fellowship positions (e.g. lecturers); this is true of 72% of graduates between 2012 and 2018.
Of those in non academic jobs, most are in the education sector (24% of all records for these graduates), followed by tech (15%), consultancy (14%), government (7%), arts (6%), health (6%), law (6%), finance (4%), media (4%), and non-profits/NGOs (4%). The top three sectors stay the same for the three program groups described above, but the percentage in tech goes down (20% Group 1, 16% Group 2, 10% Group 3) while the percentage in consultancy goes up (9% Group 1, 13% Group 2, 16% Group 3).
Finally, in order to help visualize differences in employment for different graduation years, the chart below may be useful.
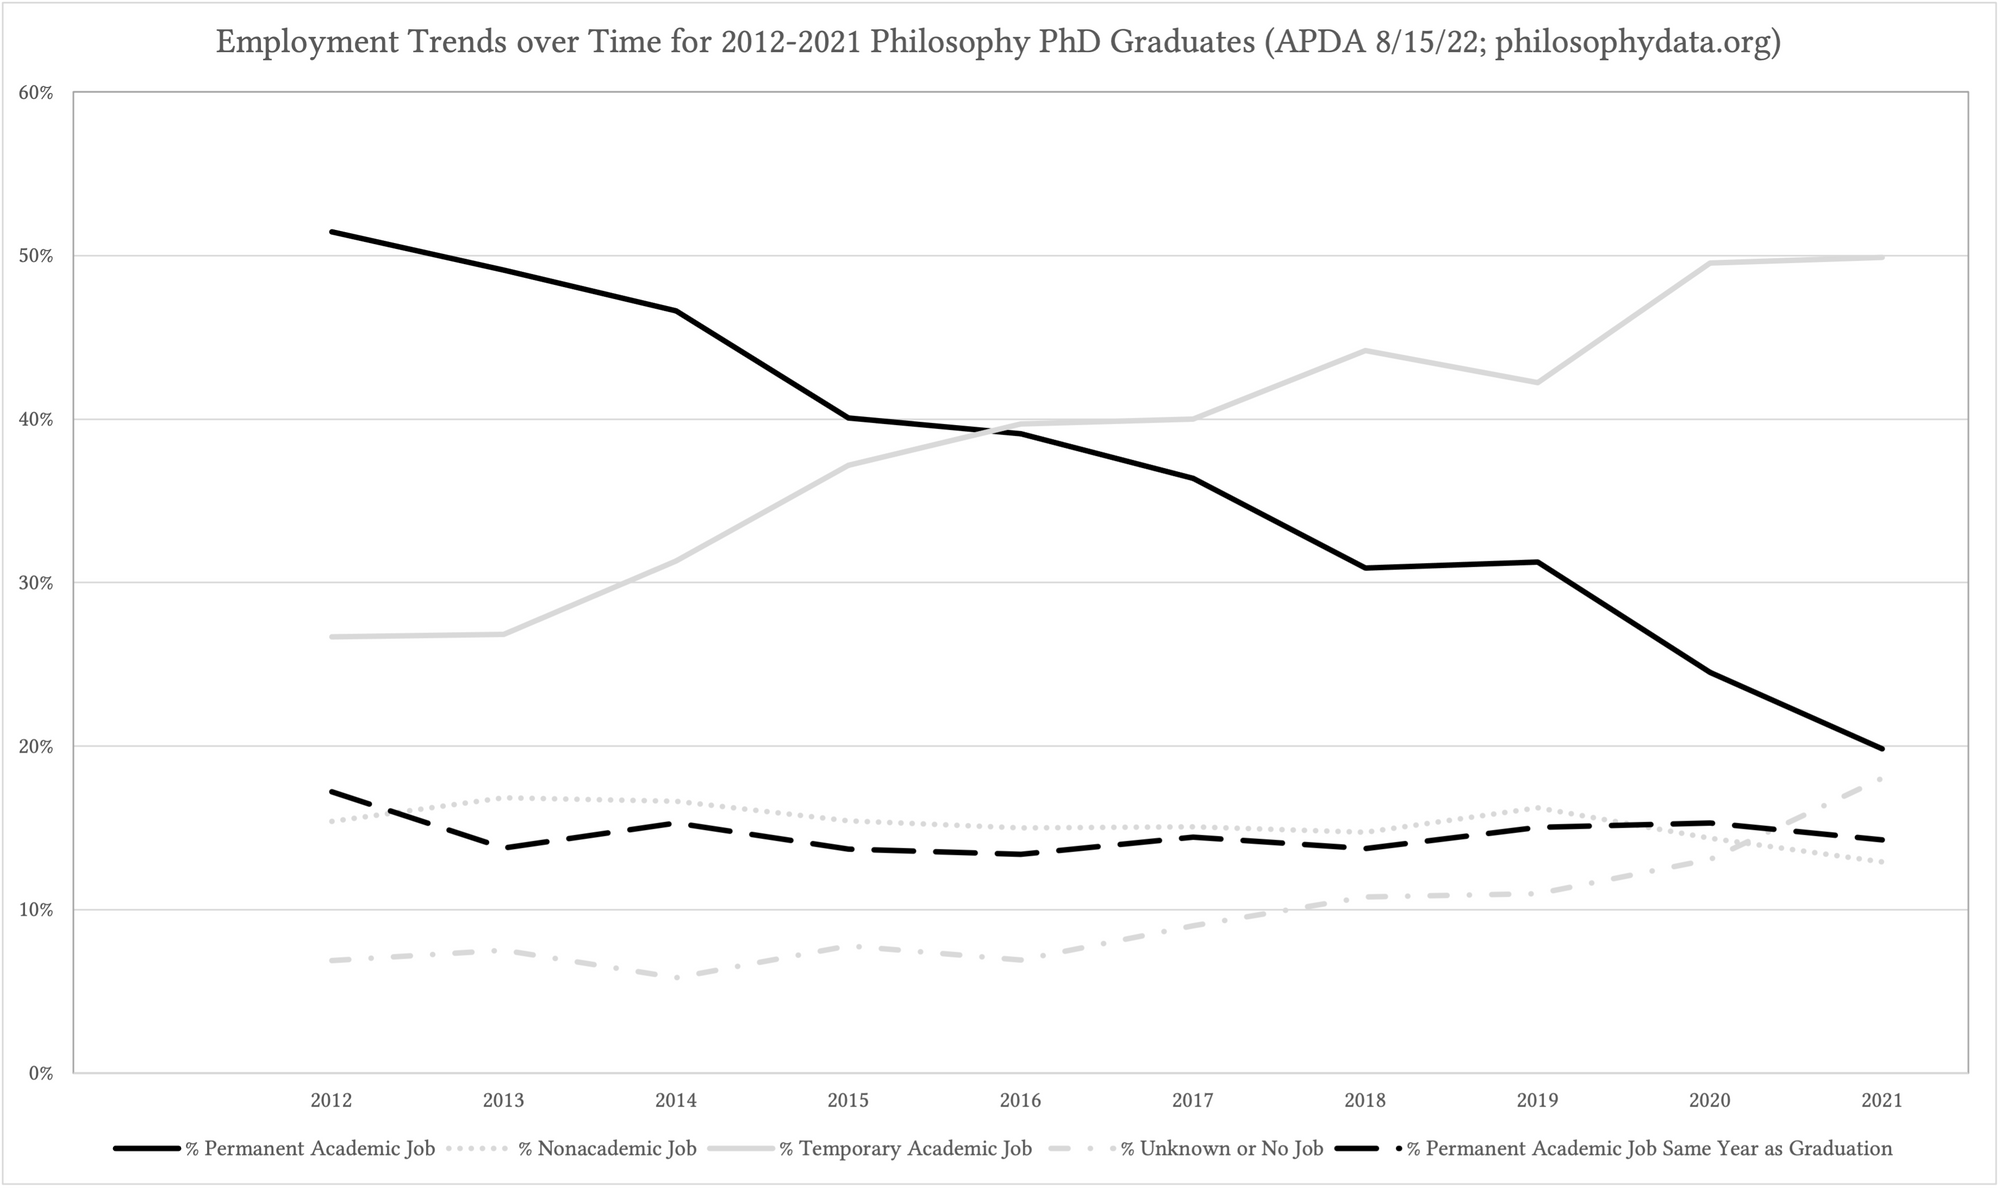
This chart depicts in black the percentage of all those in the database for this time period who are now in a permanent academic position per graduation year, with a broken line depicting the percentage who found a permanent academic position the same year as graduating. It is clear from this chart that the proportion who find permanent academic employment is lower for more recent graduation years, but that the proportion who find this employment the same year as they graduate hasn't really changed. This indicates that the primary reason for the downward slope is the number of years the graduate has had to find permanent academic employment rather than reduced chances of finding this employment overall.
(Note that this table and post may be updated between August 15th and September 1st, 2022 to reflect program updates.)
*Thanks to Ricardo Rodriguez for his work collecting data (and to the Center for the Humanities at UC Merced for funding that work), managing the website/database, and solving any technical problems this year. Thanks also to Joshua Clingo for his work redeveloping the website and database in the spring, building on earlier work by Angelo Kyrilov, Armaan Kapoor, and Karna Errande.
You can link to this post here: https://apda.ghost.io/2022-data-collection-results/