2024 Data Collection Results: a focus on recent graduates

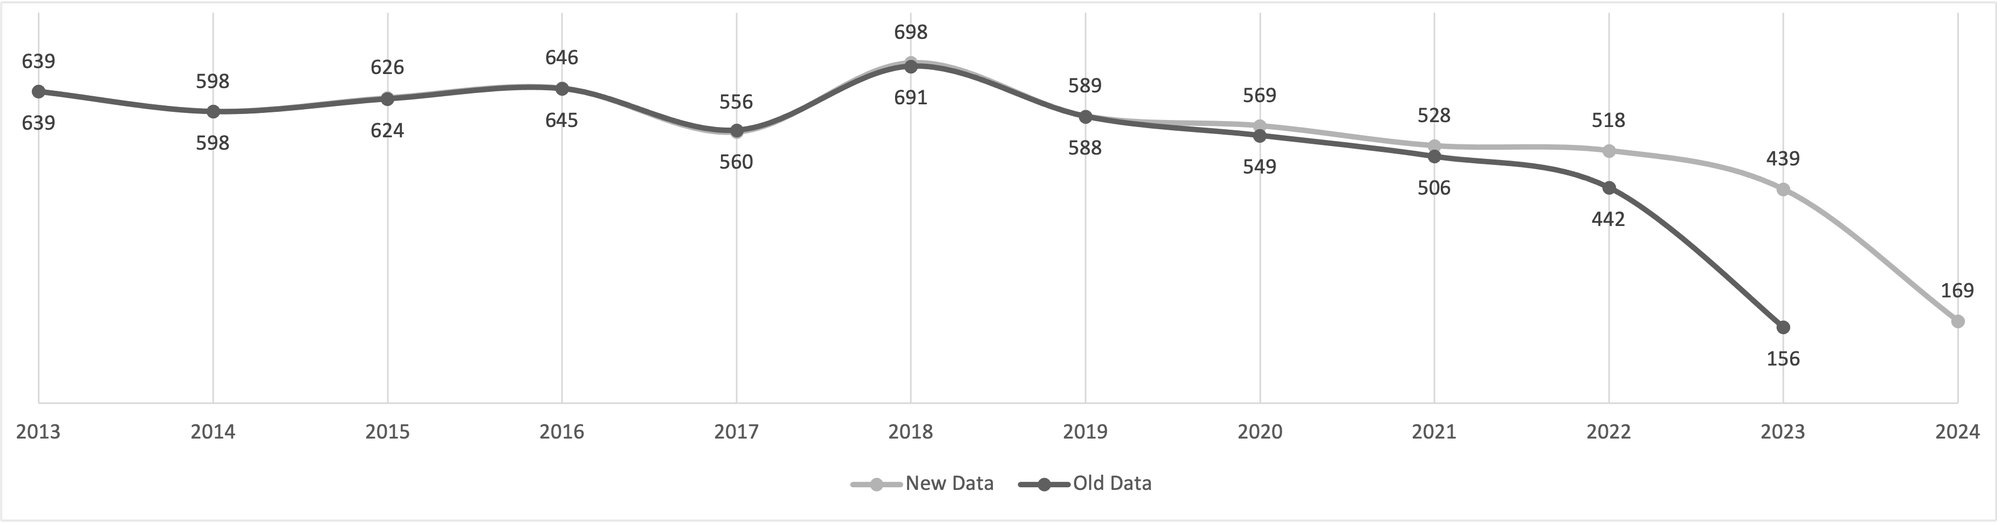
Over the spring and summer we updated the database using placement pages and other public sources of data (h/t Ricardo Rodriguez), inviting program representatives to edit their dashboards at the end of the summer. This effort led to 406 new graduates in the covered period (2013–2023), over 2/3 of which are from 2023. We have updated the interactive graphic on the homepage with this data, and you can explore individual program data through the website (e.g. ASU). Below is a chart comparing new and old data.
This update gives us a fuller picture of the state of employment for graduates in the last 10 years (2013–2023). Over this period, 6,408 graduates earned a PhD in philosophy, 41% of which (2,610) have found permanent academic employment; 33% if we look only at the past 5 years (2019–2023). These numbers are comparable to those we reported following our 2021 survey: 40% and 31%, respectively (for 2011–2021 and 2016–2021). They are also similar to the numbers from our first report on this project in 2015: of 1,964 graduates over a 4-year period, 33% of graduates were in permanent academic employment. Thus, it is unlikely that permanent academic employment has gone down in the past few years.
While individual program data can be noisy, two programs are two standard deviations away from the mean for the proportion of 2019–2023 graduates with permanent academic employment—but both are small: Cincinnati and UVA (10 and 12 graduates in this period, respectively; 70% or more in permanent academic jobs). A further ten programs were more than one standard deviation away from the mean (52% or more in permanent academic jobs) while also being at or above the mean program size (21+ graduates for 2019–2023; listed in alphabetical order): BU, Columbia, MIT, NYU, Purdue, Rutgers, SLU, CUA, Michigan, and Yale. A few of these satisfied the same criteria in the 2021 report (51% ore more in permanent academic jobs and 23+ graduates for 2016–2021): MIT, Rutgers, and CUA. (Note that I am a BU alum, a potential COI.)
A total of 25 programs have a higher than 52% permanent academic employment for 2019–2023 graduates (1 SD above the mean). These programs had higher mean recommendation ratings (4.3 vs. 3.9) and climate ratings (4.1 vs. 3.9) in the 2023 survey than all other programs covered by the project. They were twice as likely to be associated with keywords like analytic, epistemology, metaphysics, mind, and religion and half as likely to be associated with keywords like biology, german, history and philosophy of science, and political in that survey. Thus it may be that mainstream philosophy departments with higher student ratings do better with respect to permanent academic employment. (Of course, better employment rates might also be a source of higher ratings.) All covered programs are listed in a table at the end of this post, in alphabetical order (Table 1).
Similarly, looking at permanent academic employment for AOS's can be noisy. Four have rates that are one standard deviation above the mean, but three of these have a very small number of 2019–2023 graduates (listed in alphabetical order): African Philosophy (<10), American Philosophy (including Latin American; <10), Asian Philosophy (<10), and Philosophy of Law (35, 57%). Two of the large AOS's (one SD more than average) have better than average permanent academic employment: Ethics (276, 37%) and Social/Political Philosophy (239, 40%). On the other end of the spectrum, two small AOS's have rates that are one standard deviation below the mean: Philosophy of Economics (<10) and Philosophy of Math (23, 13%). Two large AOS's have below average rates: Metaphysics (131, 32%) and Philosophy of Mind (170, 28%). Thus, it may be that graduates specializing in certain philosophical traditions and areas of value theory currently do better in terms of permanent academic employment than those in more mainstream and formal areas. See the full table below (Table 2).
In the next few weeks I plan to post more results from the 2023 survey, so stay tuned!
You can link to this blog post at https://apda.ghost.io/2024-data-collection-results-a-focus-on-recent-graduates
Table 1: Philosophy PhD Programs
| University | Graduates 2019–2023 | Permanent Academic Job | Permanent Academic Employment Rate |
| Arizona State University | <10 | ||
| Arizona State University (HPS) | <10 | ||
| Australian National University | 23 | 4 | 17% |
| Baylor University | 15 | 10 | 67% |
| Binghamton University | 16 | 5 | 31% |
| Bogazici University | <10 | ||
| Boston College | 29 | 13 | 45% |
| Boston University | 22 | 15 | 68% |
| Bowling Green State University | 10 | 5 | 50% |
| Brown University | 18 | 4 | 22% |
| Carnegie Mellon University | 13 | 5 | 38% |
| Columbia University | 36 | 19 | 53% |
| Cornell University | 28 | 9 | 32% |
| Dalhousie University | <10 | ||
| Deakin University | <10 | ||
| DePaul University | 29 | 8 | 28% |
| Duke University | 20 | 11 | 55% |
| Duquesne University | 11 | 2 | 18% |
| Durham University | 24 | 1 | 4% |
| Eindhoven University of Technology | <10 | ||
| Emory University | 30 | 10 | 33% |
| Florida State University | 17 | 9 | 53% |
| Fordham University | 26 | 7 | 27% |
| Georgetown University | 18 | 4 | 22% |
| Graduate Center of the City University of New York | 48 | 8 | 17% |
| Harvard University | 24 | 10 | 42% |
| Indiana University Bloomington | 14 | 4 | 29% |
| Indiana University Bloomington (HPS) | <10 | ||
| Institut Jean Nicod | 52 | 3 | 6% |
| Johns Hopkins University | 19 | 6 | 32% |
| Katholieke Universiteit Leuven | <10 | ||
| King´s College London | 24 | 6 | 25% |
| London School of Economics and Political Science | 13 | 7 | 54% |
| Loyola University Chicago | 20 | 4 | 20% |
| Marquette University | 22 | 8 | 36% |
| Massachusetts Institute of Technology | 25 | 13 | 52% |
| McGill University | 25 | 6 | 24% |
| Michigan State University | 12 | 7 | 58% |
| National University of Singapore | <10 | ||
| New York University | 21 | 12 | 57% |
| Northwestern University | 20 | 10 | 50% |
| Ohio State University | 23 | 7 | 30% |
| Pennsylvania State University | 19 | 12 | 63% |
| Princeton University | 31 | 15 | 48% |
| Purdue University | 29 | 15 | 52% |
| Rutgers University | 25 | 17 | 68% |
| Saint Louis University | 23 | 12 | 52% |
| Simon Fraser University | <10 | ||
| Southern Illinois University | 10 | 5 | 50% |
| St Andrews and Stirling Graduate Programme in Philosophy | 44 | 10 | 23% |
| Stanford University | 30 | 10 | 33% |
| Stony Brook University | 16 | 11 | 69% |
| Syracuse University | 12 | 3 | 25% |
| Temple University | <10 | ||
| Texas A & M University-College Station | 13 | 7 | 54% |
| The Catholic University of America | 27 | 16 | 59% |
| The New School | 37 | 4 | 11% |
| The University of Manchester | 28 | 2 | 7% |
| The University of Melbourne | 23 | 0 | 0% |
| The University of Western Australia | <10 | ||
| Tilburg University | <10 | ||
| Trinity College, Dublin | <10 | ||
| Tulane University | 22 | 4 | 18% |
| University at Albany | 10 | 3 | 30% |
| University at Buffalo | 17 | 7 | 41% |
| University College London | 19 | 4 | 21% |
| University of Alberta | <10 | ||
| University of Arizona | 27 | 11 | 41% |
| University of Arkansas | <10 | ||
| University of British Columbia | 12 | 3 | 25% |
| University of Calgary | 12 | 1 | 8% |
| University of California, Berkeley | 21 | 9 | 43% |
| University of California, Davis | 20 | 5 | 25% |
| University of California, Irvine | 23 | 6 | 26% |
| University of California, Irvine (LPS) | 30 | 11 | 37% |
| University of California, Los Angeles | 24 | 10 | 42% |
| University of California, Riverside | 13 | 3 | 23% |
| University of California, San Diego | 19 | 9 | 47% |
| University of California, Santa Barbara | 10 | 4 | 40% |
| University of California, Santa Cruz | 14 | 4 | 29% |
| University of Cambridge | 21 | 9 | 43% |
| University of Cambridge (HPS) | 12 | 6 | 50% |
| University of Chicago | 28 | 13 | 46% |
| University of Chicago (CHSS) | 10 | 1 | 10% |
| University of Cincinnati | 10 | 7 | 70% |
| University of Colorado Boulder | 23 | 6 | 26% |
| University of Connecticut | 22 | 10 | 45% |
| University of Dallas | <10 | ||
| University of Edinburgh | 39 | 5 | 13% |
| University of Florida | <10 | ||
| University of Geneva | <10 | ||
| University of Georgia | 15 | 10 | 67% |
| University of Graz | <10 | ||
| University of Guelph | 10 | 1 | 10% |
| University of Hawai´i at Manoa | <10 | ||
| University of Illinois at Chicago | 19 | 7 | 37% |
| University of Illinois at Urbana-Champaign | <10 | ||
| University of Iowa | <10 | ||
| University of Kansas | 11 | 5 | 45% |
| University of Kent | <10 | ||
| University of Kentucky | 15 | 8 | 53% |
| University of Maryland, College Park | 20 | 7 | 35% |
| University of Massachusetts Amherst | 14 | 8 | 57% |
| University of Memphis | 19 | 9 | 47% |
| University of Miami | 13 | 4 | 31% |
| University of Michigan | 25 | 17 | 68% |
| University of Minnesota Twin Cities | <10 | ||
| University of Missouri | 10 | 1 | 10% |
| University of Nebraska, Lincoln | 11 | 1 | 9% |
| University of New Mexico | <10 | ||
| University of North Carolina at Chapel Hill | 30 | 9 | 30% |
| University of Notre Dame | 43 | 15 | 35% |
| University of Nottingham | 16 | 1 | 6% |
| University of Oklahoma | 13 | 3 | 23% |
| University of Oregon | 23 | 7 | 30% |
| University of Otago | <10 | ||
| University of Oxford | 63 | 18 | 29% |
| University of Pennsylvania | 26 | 13 | 50% |
| University of Pittsburgh | 21 | 7 | 33% |
| University of Pittsburgh (HPS) | 21 | 7 | 33% |
| University of Reading | 16 | 3 | 19% |
| University of Rochester | 11 | 3 | 27% |
| University of Salzburg | <10 | ||
| University of Sheffield | 23 | 4 | 17% |
| University of South Carolina | 13 | 3 | 23% |
| University of South Florida | 29 | 8 | 28% |
| University of Southern California | 20 | 12 | 60% |
| University of Tennessee | 12 | 2 | 17% |
| University of Texas at Austin | 28 | 9 | 32% |
| University of Toronto | 47 | 16 | 34% |
| University of Toronto (IHST) | 21 | 4 | 19% |
| University of Utah | 16 | 5 | 31% |
| University of Virginia | 12 | 9 | 75% |
| University of Warwick | 24 | 3 | 13% |
| University of Washington | 18 | 7 | 39% |
| University of Waterloo | 14 | 0 | 0% |
| University of Wisconsin-Madison | 17 | 8 | 47% |
| University of York | 17 | 0 | 0% |
| University of York | 17 | 0 | 0% |
| Vanderbilt University | 19 | 10 | 53% |
| Victoria University of Wellington | 10 | 0 | 0% |
| Villanova University | 20 | 6 | 30% |
| Washington University in St. Louis | 16 | 6 | 38% |
| Wayne State University | <10 | ||
| Western University | 33 | 4 | 12% |
| William Marsh Rice University | <10 | ||
| Yale University | 24 | 15 | 63% |
| York University | 13 | 5 | 38% |
Table 2: Areas of Specialization
| First-Listed Area of Specialization | 2019–2023 Graduates | Permanent Academic Job | Permanent Academic Employment Rate |
| 19th / 20th | 46 | 16 | 35% |
| Action | 14 | 6 | 43% |
| Aesthetics | 28 | 8 | 29% |
| African | <10 | ||
| American (incl Latin American) | <10 | ||
| Analytic (History of) | <10 | ||
| Ancient | 111 | 54 | 49% |
| Applied Ethics (incl Bio and Medical) | 89 | 27 | 30% |
| Asian | <10 | ||
| Biology (incl Environmental) | 32 | 10 | 31% |
| Cognitive Science / Psychology / Neuroscience / Linguistics | 75 | 22 | 29% |
| Comparative | <10 | ||
| Continental (incl Phenomenology) | 70 | 24 | 34% |
| Decision Theory | 23 | 7 | 30% |
| Economics | <10 | ||
| Education | 10 | 4 | 40% |
| Epistemology | 163 | 56 | 34% |
| Ethics | 276 | 102 | 37% |
| Gender / Race / Sexuality / Disability Studies | 73 | 36 | 49% |
| German (incl Kant) | 69 | 25 | 36% |
| History (General) | 33 | 10 | 30% |
| Language | 83 | 30 | 36% |
| Law | 35 | 20 | 57% |
| Logic | 48 | 19 | 40% |
| Math | 23 | 3 | 13% |
| Medieval / Renaissance | 27 | 11 | 41% |
| Meta-Ethics | 35 | 10 | 29% |
| Metaphilosophy (incl Experimental) | <10 | ||
| Metaphysics | 131 | 42 | 32% |
| Mind | 170 | 48 | 28% |
| Modern | 50 | 18 | 36% |
| Other | <10 | ||
| Physics | 39 | 12 | 31% |
| Religion | 33 | 10 | 30% |
| Science (General) | 99 | 31 | 31% |
| Social / Political | 239 | 96 | 40% |
| Technology | 28 | 9 | 32% |
| Value (General) | 33 | 11 | 33% |